Key Features and Benefits
Outstanding, Responsive Technical Support
WBC Industrial Network Services has almost 20 years experience supporting IntraVUE and helping control engineers use the product. Support is provided not just for using the IntraVUE product, but also help using it to identify network issues when they occur. Support goes well beyond just using IntraVUE.
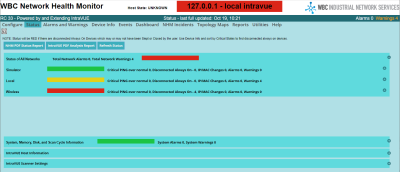
Status Page showing current health of Intravue
A single page shows the status of memory, host disk space, IntraVUE scanner speed, IntraVUE snmp collection speed, Alarms, and more. The overall data collected by IntraVUE is used to provide a simple overall indicator of Network health for each IntraVUE network. See IntraVUE Status
Instant detailed PDF Report
The PDF is generated locally, immediately and is displayed in a new browser window as well as saved to disk. The report shows the detailed status of each network and a summary of high level situations to be aware of along with corrective actions.
Focus on Critical Devices
WBC Network Health Monitor makes it easier for the user to designate which network devices are critical to production. Most utilities and graphics allow the user to easily see what is happening to critical production switches and devices without statistics from non-production devices clouding any issue.
NHM Incidents - Marginal maximum threshold responses calculated for every device for every hour of the week
Statistical analysis of every device's ping and bandwidth data is stored for and compared to current responses. Devices which respond outside the expected range generate an 'incident'. Devices are expected to generate 1 or more incidents an hour. The total number of devices in each minute which are over the expected is a measure of change to the network's operation. The total each minute for the critical devices is not expected to exceed a threshold unless there is a network issue. A threshold may be something like 35% of the critical devices reporting over-expected values. An alarm will be created if this occurs in 3 of 5 consecutive minutes. Several maps and charts help to identify problem devices. For more details See the appendix Understanding NHM Incidents and Events
Pro-Active Alarms and Warnings
Events and activity detected by IntraVUE or collected from the host computer create Alarms and Warnings. Alarms and Warnings are monitored and automatically cleared as appropriate. All alarms and warnings are logged to the database. Alarms are be emailed as they occur. For a complete list see Alarms and Warnings Appendix
- Intravue Scanner stopped
- Java or Database memory is low
- Critical Always On device has disconnected
- Possible duplicate IP addresses
- Scanner speed and/or SNMP Switch collection times are too slow/fast.
- IntraVUE KPI setting issues
- License expiring
- Too many devices in unknown Critical state
- High total incidents in a minute in a network
- Cloaked Devices joining the network
- Broadcast Storm
Discovery of devices which do not respond to pings - 'Cloaked Devices'
WBC Network Health Monitor inspects the arp cache of top parents and adds any devices having mac addresses that are not found by IntraVUE. These cloaked devices are logged as the age in and out of the arp cache.
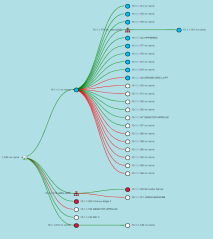
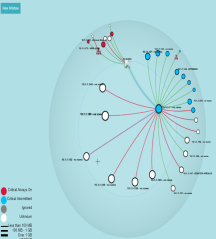
Alternate Network Maps
A Tree View Network Map and Hypertree Network Map(similar to IntraVUE 2) view of the network. The end points of the nodes change to convey different information.
Threshold Analysis and Automatic Ping and Bandwidth Threshold Setting
The Threshold Analysis and Configuration Report analyzes the last hours of IntraVUE's ping and bandwidth data and calculates meaningful threshold values. The threshold settings in IntraVUE can then be updated by the user.
By default IntraVUE sets the ping threshold to 30 milliseconds and transmit/receive bandwith to 30% for a new device. Virtually no IntraVUE user changes these default values unless a device has higher values causing many events. Devices like switches, plcs, and servers which have very low normal ping responses, e.g. 2ms, may be having issues when there response times increase to 5 or 10 ms but will not be captured by events without a meaningful threshold being set by WBC Network Health Monitor. A similar situation exists for the bandwidth setting of switches.
WBC Network Health Monitor now also automatically sets threshold values using similar logic without the user needing to do anything, see Automatic IntraVUE Threshold Setting
Graphical Dashboard
Graphics to show the worst ping and bandwidth responses for any device by minute with filtering for Critical and non-critical devices. Graphically shows the number of critical events occurring by type in each minute. See IntraVUE Dashboard
Enhanced data from Managed Switches
Creates new and loads existing switchprobe files and decodes the data into understandable tables. Cross references ip addresses and mac addresses to the IntraVUE database to provide better information.
Connection History Report and Uptime Report
Shows the dates a device was first discovered and the last time it connected or disconnected. Shows the number of days since a device last connected or disconnected. Provides a delete function to delete a device in Intravue based on how long it has been disconnected. Many IntraVUE users don't delete devices that have been disconnected for months due to the difficulty, this report makes it easy. See Connection History Report
